Application Insights for an ASP.NET Core API and an Angular SPA means both processes export telemetry to Azure Monitor so a failed checkout shows the browser page view, the API request, and the SQL or HTTP dependency under one operation. For new APIs the exporter is the Azure Monitor OpenTelemetry distro, not a hand-rolled TelemetryClient in every controller.
New to this - stay here for Azure Monitor wiring. Vendor-neutral traces - OpenTelemetry in ASP.NET Core. Managed identity for Azure - managed identity.
How do you add Application Insights to ASP.NET Core and Angular?
Search intent for application insights asp.net core is a how-to. The reader wants failed requests, dependency time, and exceptions in the Azure portal, and they want the Angular app on the same trail when the bug is "the button did nothing." They are not asking for a survey of every exporter.
This page uses the current distro for the API and the JavaScript SDK for the SPA. It points at the OpenTelemetry post instead of repeating span theory. Classic AddApplicationInsightsTelemetry still works; it is in maintenance. Do not start a new system there unless a host forces the old agent.
When does this wiring apply?
.NET 8 or later API, Angular SPA, an Application Insights resource (workspace-based) in Azure. Local development can use the same connection string or a separate dev resource. Do not point production and a laptop at one resource without sampling; your machine will drown the charts.
You need the connection string (InstrumentationKey=...;IngestionEndpoint=...). The instrumentation key alone is the old identifier. Store the API's string in configuration or app settings as APPLICATIONINSIGHTS_CONNECTION_STRING. Do not commit it. The browser copy is visible to every user; that is expected for this product, and it is why it must not be a multi-purpose secret.
How do you wire the API with UseAzureMonitor?
Watch: Do not install the classic Application Insights ASP.NET Core SDK beside UseAzureMonitor. You will spend a week debugging duplicate requests.
Package: Azure.Monitor.OpenTelemetry.AspNetCore.
var builder = WebApplication.CreateBuilder(args);

builder.Services.AddOpenTelemetry()
    .UseAzureMonitor(options =>
    {
        options.ConnectionString =
            builder.Configuration["APPLICATIONINSIGHTS_CONNECTION_STRING"];
    });

builder.Logging.AddOpenTelemetry(logging =>
{
    logging.IncludeFormattedMessage = true;
    logging.IncludeScopes = true;
});

var app = builder.Build();
app.MapGet("/api/health", () => Results.Ok());
app.Run();
UseAzureMonitor turns on ASP.NET Core request instrumentation, HttpClient dependencies, and runtime metrics, and ships them to the ingestion endpoint in the connection string. Set the service name so the portal does not label every process unknown_service:
OTEL_SERVICE_NAME=clinic-api
in the App Service settings or the container environment. Use a different name for the worker (clinic-report-worker) so a slow SQL call is not blamed on the API role.
Log with ILogger. An LogError during a request is correlated with that request. Do not log request bodies, tokens, or patient names "so we can debug." Application Insights retains what you send. Redaction is your job before the log call. A structured property TenantId is usually enough; a property named Email will be a regret.
Custom counters, when a built-in request metric is not the question:
var meter = new Meter("Clinic.Api");
var queued = meter.CreateCounter<long>("reports.queued");

// when a job is accepted
queued.Add(1, new KeyValuePair<string, object?>("tier", tier));
The meter name must be observed by the distro. The Azure Monitor distro includes application meters you register through Meter in-process when you use the standard hosting integration; if a custom meter does not appear, check that you did not build a second MeterProvider that replaces the one UseAzureMonitor added. One provider is the setup. Two providers is a silent drop.
Prefer this counter over TelemetryClient.TrackEvent copied from a 2019 sample. If you are still on the classic SDK, TrackEvent works, but do not mix both SDKs in one process "just in case." You will double-count requests and fight configuration.
What should one API call show in the portal?
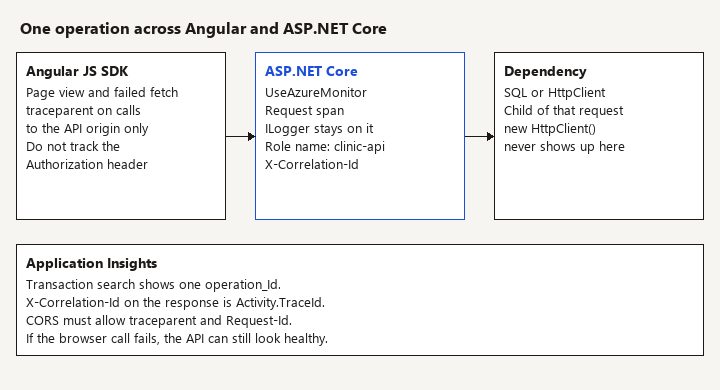
A successful POST /api/orders should show:
- a request with the route, status code, and duration
- a dependency for SQL or for the downstream
HttpClientcall - traces from
ILoggeremitted during that request
If the dependency is missing, the call did not go through an instrumented HttpClient (a static new HttpClient() you constructed yourself is a common miss, and it is also the socket-leak pattern). If SQL text appears in the dependency command, assume it contains parameter values or literals until you prove otherwise. Keep command text off in production if those statements include names or free-text notes. Duration and success still show without the text.
Sampling: the distro can sample. A default that keeps everything is fine at low volume and expensive at high volume. Decide a rate, apply it in one place, and do not also sample in a custom processor unless you understand you are sampling twice. Document the rate next to the resource name so an on-call engineer does not treat a missing request as proof the request never happened.
How do you correlate the Angular SPA?
Watch: The browser connection string is an ingestion key, not a place for storage secrets. Allow traceparent in CORS or the SPA fails while the API looks healthy.
The API must allow the correlation headers, and it should echo the trace id so support can search one operation. AllowAnyHeader also works, and it is wider than you need.
builder.Services.AddCors(options =>
{
    options.AddDefaultPolicy(policy => policy
        .WithOrigins(builder.Configuration["Spa:Origin"]!)
        .WithHeaders(
            "Authorization",
            "Content-Type",
            "traceparent",
            "tracestate",
            "Request-Id")
        .AllowAnyMethod());
});

app.UseCors();
app.Use(async (context, next) =>
{
    context.Response.OnStarting(() =>
    {
        var traceId = System.Diagnostics.Activity.Current?.TraceId.ToString();
        if (!string.IsNullOrEmpty(traceId))
            context.Response.Headers["X-Correlation-Id"] = traceId;
        return Task.CompletedTask;
    });
    await next();
});
import { ApplicationInsights } from "@microsoft/applicationinsights-web";

export function startBrowserTelemetry(connectionString: string) {
  const ai = new ApplicationInsights({
    config: {
      connectionString,
      enableAutoRouteTracking: true,
      enableCorsCorrelation: true,
      enableRequestHeaderTracking: false,
      enableResponseHeaderTracking: false,
      distributedTracingMode: 1, // AI_AND_W3C; 2 is W3C-only on recent SDKs
      correlationHeaderExcludedDomains: ["*.queue.core.windows.net"]
    }
  });
  ai.loadAppInsights();
  ai.trackPageView();
  return ai;
}
Call this once at bootstrap, with the string from environment for that slot. enableAutoRouteTracking records Angular navigations as page views. Without it you see a single hit on / and nothing when the user opens invoices.
enableCorsCorrelation adds W3C traceparent on XHR and fetch to your API so the portal can stitch the browser dependency to the server request. Turn it on only for your API origin. If you add the header to a third party that does not list it in Access-Control-Allow-Headers, the browser fails the call. Exclude those domains. Do not enable request-header tracking; Authorization will land in Azure.
The JavaScript SDK's connection string is public. Mitigations that are actually available:
- a separate Application Insights resource for the browser, so a noisy client cannot exhaust the API's daily cap
- sampling in the JS config
- a daily cap and an alert on the resource
- no authenticated ingestion unless you have a specific private-link design; do not invent a proxy that "hides" the string and then logs every event body
Do not send usernames as default authenticated user context unless product and privacy review agreed. An opaque internal id is still personal data in many products. Start with no user id. Add it when a support case cannot be solved without it, and document retention.
Which failures should you alert on?
Watch: A custom event per keystroke hits the cap and drops the 500s you meant to keep. Do not log the entire ProblemDetails bag.
Wire alerts to:
- failed request rate on the API role
- dependency failures to SQL and to the one partner you actually bill against
- a custom counter stuck at zero if "reports queued" is a heartbeat you expect during business hours
- browser exceptions (
trackExceptionhappens by default for unhandled errors) spiking after a deploy
Live metrics are for a deploy window, not for architecture. Transaction search is for one operation_Id a user pasted from a problem response. If your API does not return a correlation id on errors, add one from the current activity's trace id so support can search. That is a one-line response header, not a second telemetry stack.
Availability tests hit a public health URL. They do not prove Angular can sign in. A Playwright smoke does that. Application Insights does not replace the smoke test.
When are you stuck on the classic SDK?
If a host still requires Microsoft.ApplicationInsights.AspNetCore, builder.Services.AddApplicationInsightsTelemetry() reads the same APPLICATIONINSIGHTS_CONNECTION_STRING and will populate requests and dependencies. Keep custom tracking on TelemetryClient only in that process, and still do not log raw personal data. Plan the move to UseAzureMonitor rather than writing new TrackEvent calls into domain code. Domain code should depend on ILogger and Meter so the sink can change without a second rewrite. Do not run the classic SDK beside the distro to "compare them" in production; split that experiment by slot.
What fails in review?
- Installing
Microsoft.ApplicationInsights.AspNetCoreandAzure.Monitor.OpenTelemetry.AspNetCoretogether and debugging double requests for a week. - Putting the connection string in
appsettings.jsonthat ships in the container image for every environment. Use environment-specific configuration. - Logging the entire
ProblemDetailsextensions bag, including whatever a developer stuffed in during a incident. enableCorsCorrelationagainst the API without CORS allowingtraceparentandRequest-Id. The SPA breaks in the browser and the API looks healthy.- Tracking a custom event per keystroke or per Angular change-detection cycle. You will hit the cap and drop the 500s you cared about.
- Assuming the portal's "users" chart is accurate for an SPA that never set
setAuthenticatedUserContext. It is a cookie id, not an account. - Using the classic SDK's adaptive sampling story from an old blog on the OpenTelemetry distro without checking current options. Configure sampling from the distro's docs for the version you restored, and record the choice in an ADR.
How do you verify the operation is stitched?
- Set the connection string in a dev resource. Hit
GET /api/healthonce. Within a few minutes, transaction search shows the request for roleclinic-api. If the role name is blank,OTEL_SERVICE_NAMEdid not land on the process. - Make a request that calls
HttpClientand SQL. Both dependencies hang off the same operation. - Open the Angular route, then call the API. The end-to-end view shows a client dependency whose id matches the server request. If it does not, the correlation headers were stripped or CORS blocked them. The browser console tells you which.
- Log a dummy email at information level in a test build, find it in the portal, then delete the statement. That drill is the PII test. Do it before production.
- Stop the API and confirm the availability test or a failed-request alert fires on a threshold you chose, not on a single blip you will ignore.
- Confirm production configuration does not use the dev connection string (different
IngestionEndpointor resource). A wrong string looks like "telemetry is broken" when it is going somewhere you are not looking.
Where does this page stop?
Keep vendor-neutral instrumentation knowledge on the OpenTelemetry page. Use this page when the sink is Application Insights and the client is Angular. If you later export the same API to another vendor, keep UseAzureMonitor at the edge of composition root so the rest of the code still only sees ILogger, Activity, and Meter.