Azure Monitor workbooks for ASP.NET Core API SLOs are KQL views over Application Insights telemetry that answer three operational questions: what fraction of requests succeeded, how slow the slow ones were, and how much of the error budget a period already consumed.
ASP.NET Core  + OpenTelemetry / App Insights SDK
    v
requests, dependencies, exceptions   (Log Analytics tables)
    v
Workbook parameters  (time range, cloud_RoleName, operation)
    v
SLI charts: availability, latency, budget burn
    v
Dashboard pin / link from the on-call doc
A workbook is not the SLO. The SLO is the agreement ("99.9% of POST /api/orders succeed over 30 days," as an example you must replace). The workbook is how you stop arguing from a single failed request in the live tail.
Telemetry setup -> OpenTelemetry traces, metrics, and logs. Load and ceilings -> capacity planning.
Search intent for azure monitor workbooks asp.net core is a how-to: which tables, which aggregates survive sampling, and how to keep a health-check ping from making the API look perfect.
Define the SLI, the SLO, and the error budget
| Term | Meaning for an ASP.NET Core API | Example you must edit |
|---|---|---|
| SLI | The measurement | share of requests with success == true, weighted by itemCount |
| SLO | The target for that SLI over a window | 99.9% over 30 days |
| Error budget | 100% minus the SLO, times volume | 0.1% of requests may fail in the window |
Example only: if you chose 99.9% and you observe about 1,000,000 counted requests in the window, the budget is about 1,000 failed requests. Do not copy 99.9 or 1,000,000 into an incident channel as if this article measured your API. Read the workbook.
Split SLIs the way users feel them. One availability number for the whole App Service hides a checkout POST that fails behind a flood of healthy GETs. At minimum, separate:
- Edge availability for the API role, excluding
/health,/ready, and static files. - A user journey you can name (
POST /api/orders, or the operation name you set inActivity). - Dependency health (SQL, downstream HTTP) so you can see "we returned 500 because SQL timed out" without pretending the dependency chart is the user SLO.
Latency SLOs need a percentile and a filter. "Average duration" hides the tail. p95 or p99 of duration on the journey you care about is the usual pair to availability. State the unit after you confirm it in your workspace (next section).
Confirm the table before you trust a chart
Watch: count() under sampling is the wrong volume. Use sum(itemCount), and do not label the axis milliseconds until getschema confirms duration.
Workspace-based Application Insights stores request telemetry in requests. Two columns hurt people:
durationis documented as milliseconds (a real, not a timespan) on the Application Insightsrequestsschema. Confirm withrequests | getschemaand one sample row in your workspace before you divide by 1000. A custom OpenTelemetry pipeline that exported microseconds into a different table will not match this assumption. The workbook should label the axis "ms" only after that check.itemCountis the sampling weight. Adaptive sampling keeps a representative row and setsitemCountabove 1.count()counts stored rows, not user calls.sum(itemCount)estimates calls.sumif(itemCount, success == false)estimates failures. If sampling is off,itemCountis 1 and the two queries match. Write the weighted form anyway so a later sampling change does not silently rewrite history.
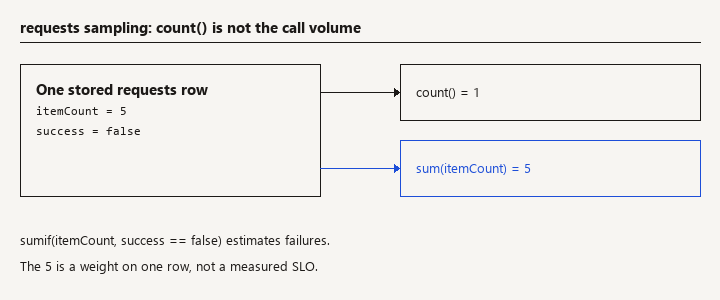
success is the SDK's notion of success. A client abort can show up as a failed request depending on status code and version. Decide whether resultCode 499 (or your cancellation code) counts against the SLO. For an example user-facing availability SLI, exclude health probes and count 5xx plus explicit failed dependency timeouts, and document cancellations separately so a user refreshing a spinner does not burn the budget.
cloud_RoleName must be set on the ASP.NET Core app or every service in the subscription shares one chart. Set the cloud role name in telemetry init and refuse to build the workbook until staging and production differ.
Emit the rows the workbook counts
The KQL below reads requests (and, if you add a tile, customMetrics). Those rows are not created by the workbook. The Azure Monitor OpenTelemetry distro creates a requests row per ASP.NET Core call, and cloud_RoleName is the service name you set here. /health keeps the name the availability query excludes. POST /api/orders is the operation you pass as {Operation}.
using Azure.Monitor.OpenTelemetry.AspNetCore;
using OpenTelemetry.Resources;
using System.Diagnostics.Metrics;

var builder = WebApplication.CreateBuilder(args);

builder.Services.AddOpenTelemetry()
    .ConfigureResource(resource => resource.AddService(serviceName: "clinic-api"))
    .UseAzureMonitor();

var meter = new Meter("Clinic.Api");
var ordersFailed = meter.CreateCounter<long>("orders.failed");

var app = builder.Build();

// Becomes a requests.name the workbook drops: GET /health
app.MapGet("/health", () => Results.Ok());

// Becomes requests.name "POST /api/orders" for the latency tile.
app.MapPost("/api/orders", (OrderRequest body) =>
{
    if (body.Qty <= 0)
    {
        ordersFailed.Add(1, new KeyValuePair<string, object?>("route", "POST /api/orders"));
        return Results.ValidationProblem(new Dictionary<string, string[]>
        {
            ["qty"] = ["Must be at least 1."]
        });
    }

    return Results.Ok(new { id = Guid.NewGuid() });
});

app.Run();

public sealed record OrderRequest(string Sku, int Qty);
Set the workbook RoleName parameter to clinic-api, the same string as AddService. The counter shows up as a custom metric named orders.failed if you add a tile later. It does not replace the requests availability query. Sampling can still set itemCount above 1; keep sum(itemCount) in the workbook either way.
Write the KQL the workbook should run
Watch: Health probes at full success hide a broken POST. Exclude them, and do not put one SLO on static files and checkout together.
Availability for one role, health checks removed, weighted for sampling:
requests
| where timestamp between (todatetime({TimeRange:start}) .. todatetime({TimeRange:end}))
| where cloud_RoleName == '{RoleName}'
| where name !startswith "GET /health" and name !startswith "GET /ready"
| summarize
    total = sum(itemCount),
    failed = sumif(itemCount, success == false)
    by bin(timestamp, 1h)
| extend availability = iff(total == 0, 0.0, 100.0 * (total - failed) / total)
| project timestamp, total, failed, availability
Latency on one operation. duration here assumes milliseconds; see the check above.
requests
| where timestamp between (todatetime({TimeRange:start}) .. todatetime({TimeRange:end}))
| where cloud_RoleName == '{RoleName}'
| where name == '{Operation}'
| summarize
    p50 = percentile(duration, 50),
    p95 = percentile(duration, 95),
    p99 = percentile(duration, 99),
    n = sum(itemCount)
    by bin(timestamp, 1h)
percentile() over sampled rows is an estimate. Say that on the tile. If the SLO is contractual, prefer a pre-aggregated metric (OpenTelemetry histogram exported to Application Insights customMetrics, or a managed Prometheus bucket) rather than a percentile over sampled request rows. The workbook can still display the request-row percentile as a diagnostic, labeled as sampled.
Error budget burn for a window, with the target passed in as a parameter so the tile is not hard-coded to a blog number:
let target = todouble({SloPercent});
requests
| where timestamp between (todatetime({TimeRange:start}) .. todatetime({TimeRange:end}))
| where cloud_RoleName == '{RoleName}'
| where name !startswith "GET /health"
| summarize total = sum(itemCount), failed = sumif(itemCount, success == false)
| extend
    availability = iff(total == 0, 0.0, 100.0 * (total - failed) / total),
    budgetRequests = total * (100.0 - target) / 100.0,
    budgetUsedPct = iff(budgetRequests == 0, 0.0, 100.0 * failed / budgetRequests)
Dependencies, so a SQL stall is visible next to the API SLO and not confused with it:
dependencies
| where timestamp > ago(24h)
| where cloud_RoleName == '{RoleName}'
| where type == 'SQL'
| summarize
    calls = sum(itemCount),
    failed = sumif(itemCount, success == false),
    p95 = percentile(duration, 95)
    by target, bin(timestamp, 1h)
Parameterize TimeRange, RoleName, and Operation in the workbook. A query you edit by hand before every incident will be edited wrong at 02:00.
Build the workbook and keep the KQL in source control
Watch: A workbook does not page anyone. Alert on the same query if budget burn is actionable, and do not leave an example target as the parameter default.
In the portal: Application Insights resource -> Workbooks -> New. Add a parameters pane, then one query step per SLI. Set the availability step to a time chart and the budget step to a single-number tile. Name the steps the way an on-call engineer speaks ("Order POST availability," not "Query 1").
Pin the finished workbook to an Azure dashboard the team already opens. A workbook nobody can find is a saved query with extra steps.
To promote it, export the ARM/Bicep from the workbook's source view and ship that JSON through the same pipeline as the app. The resource type is Microsoft.Insights/workbooks. The body is the serialized gallery JSON the portal produced. Check the exported JSON into source control; do not try to hand-author the full gallery document. Review diffs when someone changes a KQL string. Treat a workbook change as an observability change, not a click that production will remember.
Use a separate workbook or a separate parameter default for staging. Mixing stages in one unfiltered requests table is how a load test looks like a production incident. Put the load-test role name in the test harness so it can be excluded.
Empty charts are data. If total is 0, the tile should say "no traffic," not "100% available." The iff(total == 0, 0.0, ...) above prefers a scary zero to a fake perfect score; pick the display you want, but do not leave a divide-by-zero.
What makes an SLO chart lie?
count()under sampling. The chart gets smoother and wrong. Usesum(itemCount).- Health probes in the numerator. A probe every 10 seconds at 100% success will hide a broken POST. Exclude them by name or by a custom dimension you set in middleware.
- One SLO for every route. Static file GETs and checkout POSTs do not share a budget.
- Duration unit assumed. Label ms only after
getschemaand a sample. Dividing milliseconds by 1000 and calling it milliseconds makes a fast API look absurd, or the reverse. - Alerting on the workbook tile by eye. A workbook does not page you. Create an Azure Monitor alert on the same KQL (or on a metric) if the budget burn is actionable. The workbook is for explanation during the page.
- Logging PII into custom dimensions you then group by. Operation name, route template, status code, and tenant category are useful. Email, national id, and raw URLs with query tickets are not. The workbook will happily chart whatever you ingested.
- Forgetting sampling when you compare to server request logs. IIS logs and
requestswill not match row-for-row once sampling is on. Compare weighted sums, or turn sampling off on a staging slot for a calibration window. - Copying an example 99.9 into the parameter default and never holding the meeting. The default becomes the target by accident.
How do you verify the workbook matches the Logs blade?
requests | where timestamp > ago(15m) | project name, duration, itemCount, success, resultCode, cloud_RoleName | take 20shows the role name you expect and a duration unit you can explain.- A synthetic failed request in staging moves
failedand the availability tile in the next bin. If it does not, the filter is wrong, not the app. - With sampling enabled,
sum(itemCount)is greater than or equal tocount()for the same window. If it is smaller, you are not looking at the column you think. /healthtraffic does not change the availability tile. Hit the probe and watch.- Staging and production are different
RoleNamevalues, and the production workbook parameter does not default to a union of both. - The workbook JSON is in source control and the KQL in the availability step matches the query you tested in the Logs blade.
- The SLO percent parameter is the number from your own agreement. The examples in this article are not that number.
Once those checks pass, the workbook is safe to pin. It will still be wrong if the telemetry is wrong, which is what step 1 is for.