Capacity planning for ASP.NET Core APIs means naming the demand you must serve, naming the resource that will run out first, and writing down the headroom you will keep. It is a checklist you revisit when the product changes, not a benchmark trophy.
Demand (peak RPS, payload, concurrency, read/write mix)
    v
Ceilings (CPU, thread pool, GC, SQL pool, HTTP pool, Redis, bandwidth)
    v
Measure (baseline, stress, soak, spike) on production-shaped data
    v
Budget + trigger (what number makes you scale, cache, or shed load)
Little's law is the whole math you need at this stage: concurrency is arrival rate times time in the system. In symbols, L = λ × W. If about 20 requests per second each spend about 0.2 seconds inside the API, you have about 4 requests in flight on average. Those numbers are an illustration of the formula, not a measurement of your API. Plug in your own λ and W from telemetry. The point of the formula is that a slower dependency raises concurrency even when traffic does not.
Where the graphs live -> Azure Monitor workbooks. Shedding load -> rate limiting. Seeing the ceiling -> OpenTelemetry.
Search intent for capacity planning asp.net core is a checklist: what to inventory, what to measure, and which "scale the pods" instincts are wrong.
Write down the demand, not a vibe
- Peak request rate for the busiest route, and the average, kept as two numbers.
- The window that matters (a morning clinic rush, a month-end export), not "a typical Tuesday" if Tuesday is not the peak.
- Payload size in and out for that route, including the list endpoints someone will call with the maximum page size.
- Read/write mix. A read-heavy GET and a transactional POST do not share a plan.
- Concurrent users versus requests per second. Browsers open more than one call per click. SignalR or gRPC streams hold a connection while idle; they are a connection plan, not an RPS plan.
- Background work on the same process (hosted services, consumers). Capacity for HTTP alone is wrong if the worker shares the thread pool and the SQL pool.
- Growth you are actually committing to (a launch, a new tenant). "10x someday" is not a number you can buy hardware for. Pick a horizon.
If you cannot fill the first two boxes, you are not ready to pick an SKU. Spend the time in workbooks or logs. Guessing RPS and then load-testing the guess only proves the guess.
Find the ceiling that will hit first
Walk the request. The first saturated pool loses, and the API CPU graph may still look calm.
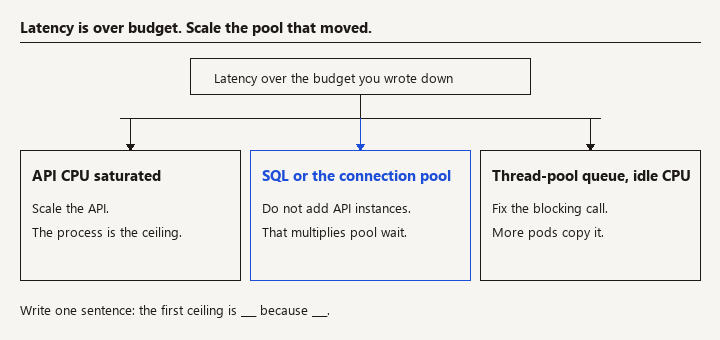
- SQL. CPU, data IO, log IO, lock waits, and the connection pool. EF's default SQL pool max is 100 connections per pool (per connection string, per process). Each extra API instance multiplies that. A pool waiting on connections looks like a slow API.
- Thread pool. Synchronous IO,
.Result, and blocking locks starve it. The symptom is growing request latency with idle CPU. Scaling out copies the bug. - GC and allocations. Large JSON responses and
ToListof fat entities show up as GC pauses, not as "we need a bigger DTU" by themselves. Fix the query shape (N+1 and projections) before you buy a tier. - HTTP client pool.
HttpClient/SocketsHttpHandlerconnection limits to a downstream. One dependency with a low connection cap caps the API no matter how many cores you give Kestrel. - Redis or another cache. A cache stampede on expiry is a capacity event. Note the TTL and whether expiry is aligned.
- Kestrel and the proxy. Connection limits, request body size, and the reverse proxy's idle timeout. A long export holds a connection; count those separately from short JSON calls. See download streaming.
- CPU and memory of the API process, last. They matter, and they are the ones people scale by reflex because the chart is on the front page.
- License and SKU caps (Azure SQL tier, Redis size, App Service plan). A cheap tier's governor is a ceiling even when the VM looks idle.
Write one sentence: "The first ceiling is ___ because ___." If you cannot, the next step is a measurement, not a purchase.
Watch: Buying a bigger plan before you can name the saturated pool scales the calm CPU chart. The ceiling is often SQL or the thread pool, and more API instances make that pile-up worse.
Measure on a stack production will recognize
- Staging data volume is in the same order of magnitude as production, or you have a stated reason a smaller set still produces the same query plan.
- The test runs through the real stack you ship (Kestrel behind the same proxy class, the same EF version, pooling on).
- Baseline: expected peak for a sustained interval. Record latency percentiles and error rate, not only RPS achieved.
- Stress: increase until errors or a latency knee. Note which resource moved first (the sentence in section 2).
- Soak: a longer run at baseline watching memory, connection counts, and handle counts. Leaks do not show up in a 60-second hero run.
- Spike: a short jump above peak, then back. See whether the thread pool and SQL recover or stay on the floor.
- Tests include the auth header, the real JSON shape, and a realistic mix of routes. A benchmark of
GET /healthis a benchmark of/health. - You kept the raw result (tool, date, commit, data size). A number without that context will be quoted after the code has changed.
- During the baseline, record requests per second, a latency percentile, and thread-pool queue length with the commands in the next section.
- Set Kestrel's connection limit and max body size in
Program.cs, so that ceiling is a value you chose rather than a default you have not read.
Do not publish those results as if they were universal ASP.NET Core limits. They describe one build, one database, one shape. This checklist deliberately does not include a "you should handle N requests per second" line. N comes from your run.
Watch: A requests-per-second figure from this run is not a limit of ASP.NET Core. Quoting it for the next service, or from a laptop profile, is how the plan lies.
Record Kestrel limits and the baseline counters
Section 2 names ceilings. These are a ceiling you can point at in code, and the readout for a baseline run. They are not a tuning recipe. If thread-pool queue length is the number that moves, do not start by raising MaxConcurrentConnections.
builder.WebHost.ConfigureKestrel(options =>
{
    options.Limits.MaxConcurrentConnections = 1_000;
    options.Limits.MaxConcurrentUpgradedConnections = 100;
    options.Limits.MaxRequestBodySize = 1_048_576;
    options.Limits.KeepAliveTimeout = TimeSpan.FromSeconds(60);
    options.Limits.RequestHeadersTimeout = TimeSpan.FromSeconds(30);
});
One thousand connections is a stand-in so the limit is visible. It is not a target for your SKU. Lower it when you are protecting a small SQL tier. Raise it only after a run shows Kestrel refusing connections while SQL and the thread pool are still idle.
Leave the API running. In a second terminal, attach counters. dotnet-counters ps prints process ids and names. If a counter name below is missing on your runtime, run dotnet-counters list --process-id against that same process and use the instrument with the same meaning. The names have moved before.
dotnet-counters monitor `
  --process-id 1234 `
  --counters System.Runtime,Microsoft.AspNetCore.Hosting
Drive the route you inventoried in section 1, not /health. The bearer token comes from the environment so it is not committed. bombardier (opens in a new tab) prints throughput and a latency distribution for that URL. Confirm the switches with bombardier -h if the build you installed differs.
bombardier `
  -c 40 `
  -d 30s `
  -l `
  -H "Authorization: Bearer $env:LOAD_TOKEN" `
  http://localhost:8080/api/catalog
How to read the pair against the checklist:
- RPS. Compare bombardier's requests-per-second figure with
requests-per-secondunderMicrosoft.AspNetCore.Hostingfor the same window. They should land in the same range. A large gap means the tool is not hitting this process. - Latency. Use the upper percentile bombardier prints (p95, or the closest bucket), not the average. That is the number you will compare with the latency budget in the next section.
- Thread-pool saturation.
threadpool-queue-lengthabove zero for the whole run, whilecpu-usagestays low, means work is blocked: sync-over-async, a lock, or a SQL pool that cannot hand out connections. More API instances copy that.threadpool-thread-countclimbing for the whole run is the same story, slower. - Errors. HTTP 429 means a limiter you configured has fired. That is a ceiling you chose. HTTP 500 during the run means you passed a real ceiling. Write down which resource moved, as section 2 asked.
Thirty seconds only proves the wiring. The soak box above is still a longer run. Do not file the bombardier summary as the capacity plan by itself.
Watch: A 30-second bombardier summary proves the wiring, not the capacity. Filing it as the plan skips the soak, the peak window, and whichever pool actually moved.
Set a budget and a trigger
- Latency budget per important route (an example shape: p95 under a threshold you choose, at or below peak). Tie it to the SLO in the workbook, not to a number from a conference talk.
- Error budget aligned with that SLO, so a capacity test that "only" fails 2% knows whether 2% is acceptable.
- Headroom stated as a fraction of the knee you measured (for example, run steady at well under the stress point where errors started). The fraction is a business choice. Write it down.
- A trigger that is a resource, not a feeling: SQL CPU above a line you picked, pool wait time non-zero, p95 over budget for a sustained window.
- The response to each trigger: scale the thing that saturated, or change the code (query, cache, queue), or shed load with rate limiting and a 429 the client understands.
- Who is allowed to scale production, and how the change is rolled back.
Horizontal scale helps CPU-bound, stateless request paths. It does not help a single-writer SQL hotspot, a lock in the application, or a dependency whose own capacity you already exhausted. Vertical scale helps a single instance that is actually out of CPU or RAM. Neither replaces an index.
Revisit the plan when the system changes
- A new hot route, a larger page size, or a report moved onto the request path.
- A new tenant or customer larger than the ones you modeled.
- An EF or runtime upgrade. Pool defaults and GC behavior have changed across releases before; re-baseline after the upgrade instead of assuming the old knee.
- A dependency moved regions. Latency went up, so by Little's law concurrency went up, even if RPS did not.
- The plan is at least reviewed on a cadence you can keep (quarterly is enough for a portfolio API that is not in a launch). After an incident that was "we ran out of X," update the ceiling sentence the same week.
What does a bad capacity plan assume?
- Planning from the average and discovering the peak during the peak.
- Adding API instances while SQL connection waits are the actual graph moving.
- Load-testing with an empty database so every query is a memory grant and a seek that production will not get.
- One global thread-pool or connection-pool tweak copied from an article that diagnosed a different symptom.
- Treating a single developer laptop profile as capacity. Client CPU, local SQL, and no network RTT will flatter you.
- Ignoring background services that wake up at the same minute as the user spike.
- Capacity as a one-time spreadsheet that nobody re-runs after the checkout rewrite.
How do you know the plan is done enough to ship?
The plan is done enough to ship when each box below is a sentence with a number you measured, not a number you hoped:
- Peak and average demand for the top route, with the window named.
- The first ceiling, and the graph that will show it saturating.
- A baseline run and a stress run tied to a commit.
- A latency and error budget that matches the SLO you tell users about.
- A trigger and a response, including "do not scale the API if the ceiling is SQL."
When a box is empty, the honest capacity plan is "we do not know yet," which is a better status than a precise fiction.